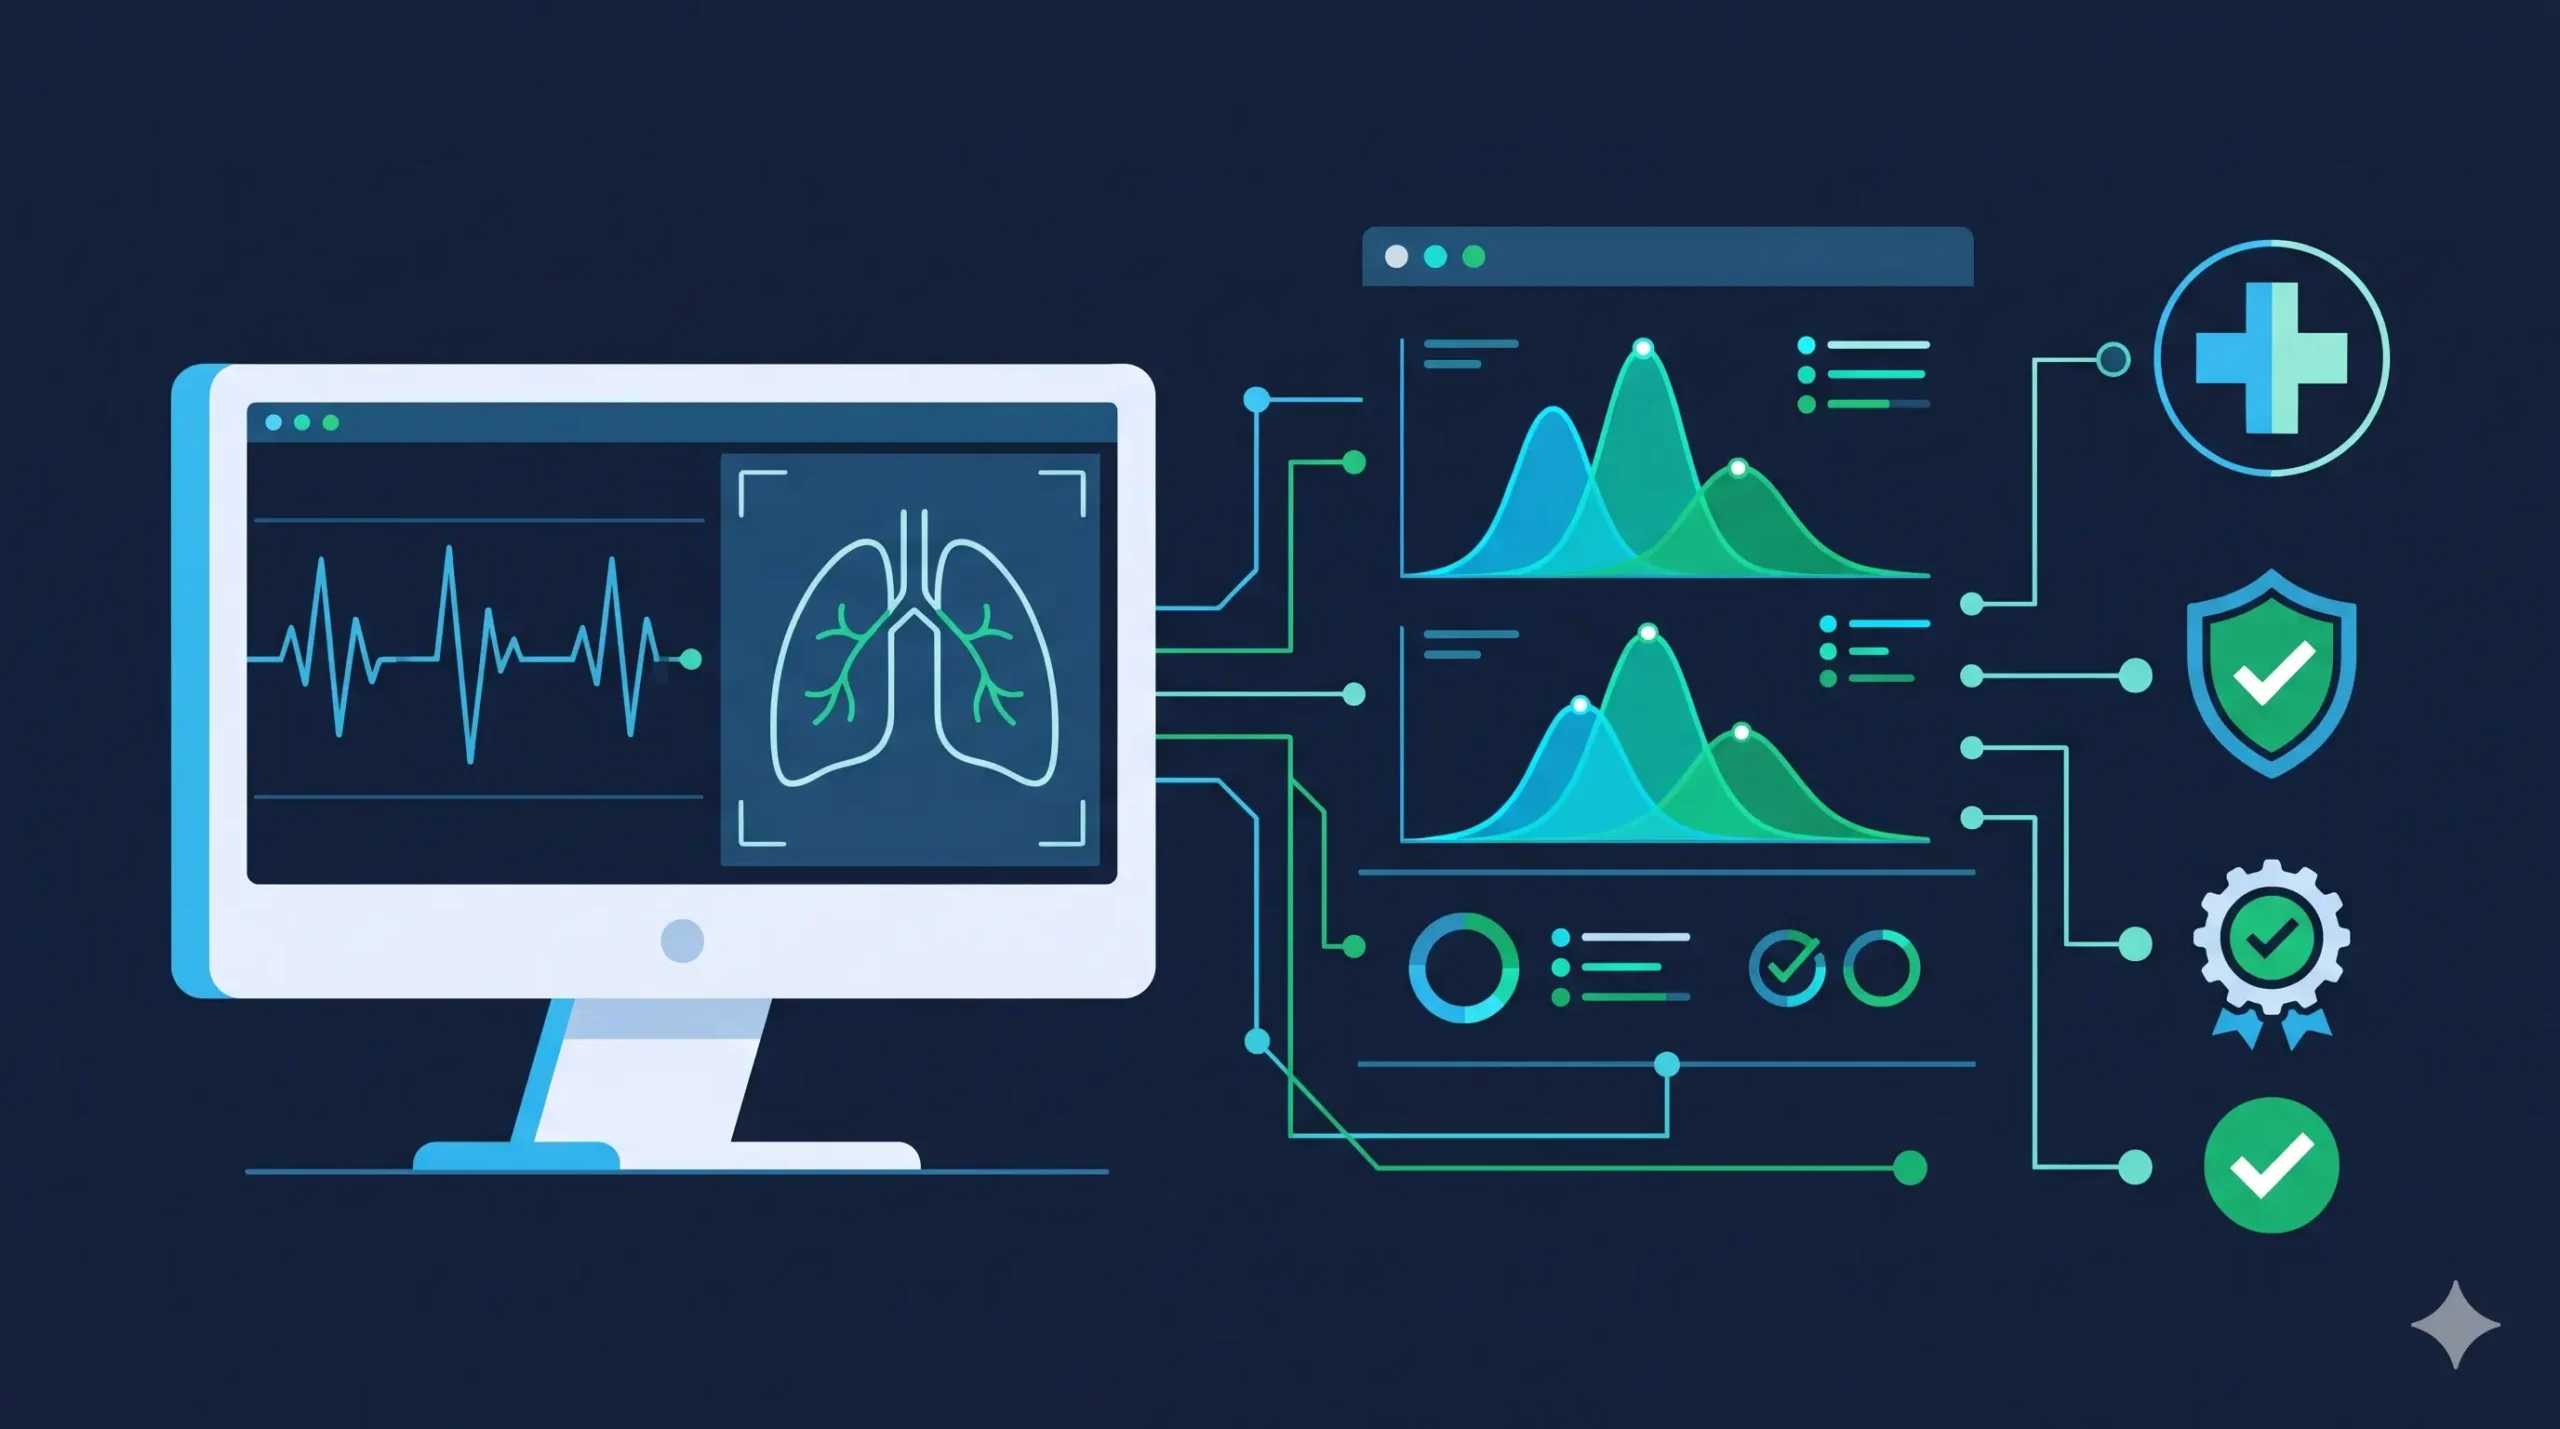
Clinical artificial intelligence does not fail with loud system crashes or fatal memory leaks. It fails silently through statistical decay. When an algorithm deployed as Software as a Medical Device (SaMD) encounters subtle shifts in patient demographics, imaging acquisition protocols, or clinical diagnostic thresholds, its inference accuracy degrades while its prediction confidence remains dangerously high.
Under the FDA Quality Management System Regulation (QMSR, 21 CFR Part 820 incorporating ISO 13485:2016) and the agency’s pre-market expectations for Predetermined Change Control Plans (PCCP), passive post-market surveillance is no longer compliant. Regulators expect manufacturers of machine learning-enabled medical devices (MLMD) to implement a prospective, mathematically defensible AI model drift monitoring medical device strategy. Building this protocol requires medical device manufacturers to bridge advanced MLOps statistical monitoring with formal Design Controls, Risk Management (ISO 14971:2019), and Corrective and Preventive Action (CAPA) systems.
💡 Key Takeaways: AI Model Drift Governance for SaMD
- Differentiate Drift Modalities: Regulators require distinct telemetry for data drift (covariate shift in clinical inputs, such as scanner hardware variations) versus concept drift (decay in the clinical relationship between inputs and diagnostic truth, such as revised pathology diagnostic guidelines).
- Quantified Alert Triggers: Pre-define non-parametric statistical metrics (e.g., Population Stability Index PSI ≥ 0.25, Wasserstein distance, or Kolmogorov-Smirnov p < 0.01) alongside clinical sensitivity/specificity degradation thresholds (≥ 3% drop from cleared baseline) to trigger automated QMS escalations.
- Locked vs. Continuous Learning: Satisfying expectations for continuous learning machine learning FDA pathways requires pre-specifying monitoring boundaries, retraining triggers, and validation protocols inside an authorized PCCP Modification Protocol.
- QMS & CAPA Closed Loops: Telemetry alerts must tie directly into ISO 13485:2016 Clause 8.2.1 (Feedback) and Clause 8.5.2 (Corrective Action) to enforce automated circuit breakers or rollbacks before patient safety is compromised.
Table of Contents
- Data Drift vs. Concept Drift in Medical Device AI: Clinical & Statistical Anatomy
- AI Model Drift Monitoring Medical Device Architecture: Metrics & Thresholds
- Satisfying FDA Pre-Market Expectations for Continuous Learning Machine Learning
- QMS Integration: Connecting Drift Telemetry to ISO 13485:2016 & QMSR Workflows
- End-to-End SaMD Model Drift Monitoring Implementation Checklist
- Frequently Asked Questions (FAQ)
- Strategic Perspective: Moving from Reactive Patching to Resilient SaMD Lifecycle Governance
1. Data Drift vs. Concept Drift in Medical Device AI: Clinical & Statistical Anatomy
In medical device AI, data drift (covariate shift) occurs when incoming clinical input distributions P(X) change—such as new CT scanner kernels or staining reagents—while diagnostic rules stay constant. Concept drift occurs when the clinical relationship between inputs and ground truth P(Y|X) shifts due to updated treatment guidelines or novel disease variants.
A compliant monitoring plan begins by decomposing performance decay into its underlying statistical and clinical drivers. In production healthcare environments, machine learning degradation manifests across three distinct mathematical distributions:
DATA DRIFT (Covariate Shift)
Distribution Shift: P(X) changes while P(Y|X) remains mathematically static.
- New CT scanner slice thickness / kernel
- Pathology H&E staining reagent update
- Patient demographic age/sex mix shifts
CONCEPT DRIFT (Diagnostic Shift)
Relationship Shift: P(Y|X) changes even when P(X) appears unchanged.
- Revised clinical staging criteria
- Novel disease variant or pathogen
- Shifts in standard-of-care therapeutics
Data Drift (Covariate Shift)
Data drift occurs when the input feature distribution P(X) changes over time, while the posterior probability distribution P(Y|X) remains constant. In clinical software, this is the most frequent form of software as a medical device model drift. The underlying biology of the disease has not altered, but the digitized representation fed into the model has shifted.
- Clinical Radiology Example: A computer-aided detection (CADe) algorithm trained on chest CT scans from GE Revolution scanners with 1.25 mm slice thickness is deployed in a hospital network that upgrades to Siemens SOMATOM scanners utilizing 0.625 mm reconstruction kernels and iterative reconstruction algorithms. The altered pixel-noise texture and spatial frequency trigger out-of-distribution feature vectors, causing the convolutional neural network (CNN) to over-call normal interstitial markings as pulmonary nodules.
- Pathology WSI Example: A digital pathology SaMD analyzing whole-slide images (WSI) experiences covariate drift when a laboratory transitions from automated Hematoxylin and Eosin (H&E) slide stainers to an alternate chemical formulation, altering the RGB color histogram and saturation distribution across digitized tissue tiles.
Concept Drift (Diagnostic & Semantic Shift)
Concept drift occurs when the fundamental relationship between input features and target ground truth changes: P(Y|X) shifts, regardless of whether the marginal input distribution P(X) changes.
- Clinical Triage / Sepsis Example: An automated clinical decision support (CDS) model predicts in-hospital sepsis deterioration using electronic health record (EHR) telemetry (heart rate, lactate, white blood cell count). A hospital implements a new rapid antibiotic administration protocol at the triage desk. The physiological features measured two hours post-triage no longer correlate with 24-hour mortality in the same statistical manner. The model’s positive predictive value (PPV) plummets because the clinical context governing patient survival has fundamentally evolved.
- Epidemiological & Diagnostic Shift: An infectious disease diagnostic tool classifying viral respiratory illness from lung ultrasound waveforms experiences concept drift upon the emergence of a novel pathogen variant that presents with distinct subpleural consolidations.
Prior Probability Shift (Prevalence Drift)
Prior probability shift occurs when the distribution of true class labels P(Y) changes, while the class-conditional feature distributions P(X|Y) remain stationary. In diagnostic imaging and laboratory triage tools, seasonal epidemic waves, regional outbreaks, or shifts in hospital referral status (e.g., community clinic versus tertiary cancer center) directly alter disease prevalence. While sensitivity and specificity are theoretically invariant to prevalence, real-world positive and negative predictive values (PPV and NPV) fluctuate wildly, altering clinical utility and clinician trust.
| Drift Modality | Statistical Notation | Clinical Root Cause Example | Impact on Model Performance | Primary Detection Methodology |
|---|---|---|---|---|
| Data Drift (Covariate Shift) | Pt(X) ≠ P0(X) | Scanner calibration, imaging protocol modifications, EHR format shifts | Inflation of false positives, degradation of certainty/calibration | Population Stability Index (PSI), Wasserstein Distance, KS-Test |
| Concept Drift | Pt(Y|X) ≠ P0(Y|X) | Updates to clinical practice guidelines, new drug treatments | Collapse of clinical sensitivity, diagnostic classification errors | Sequential ground-truth audits, AUROC/F1-score tracking |
| Prior Probability Shift | Pt(Y) ≠ P0(Y) | Seasonal epidemic outbreaks, transition from screening to referral site | Marked shifts in PPV/NPV; over-alerting or under-alerting | Label frequency tracking, Bayesian prevalence estimation |
2. AI Model Drift Monitoring Medical Device Architecture: Metrics & Thresholds
An effective AI model drift monitoring medical device architecture combines three telemetry tiers: real-time unsupervised input checks (PSI ≥ 0.25, KS-test, Wasserstein distance), intermediate prediction entropy and clinician override tracking, and delayed ground-truth clinical sensitivity audits mapped to ISO 14971 risk thresholds.
A robust AI model drift monitoring medical device plan cannot rely on generic machine learning heuristics. Medical device software must establish quantitative, multi-tiered alerting thresholds linked directly to documented risk acceptability criteria per ISO 14971:2019 Medical devices — Application of risk management to medical devices.
Multi-Tiered Drift Monitoring Matrix
- Population Stability Index (PSI): Bin-wise relative entropy
- Two-Sample Kolmogorov-Smirnov (KS) Test: Continuous feature distribution divergence
- Wasserstein Metric (Earth Mover’s Distance): Feature space transport cost
- Embedding Vector Reconstruction Error: Autoencoder latent space drift
- Softmax Prediction Entropy: Uncertainty distribution tracking
- Target Class Ratio (Predicted Prevalence): Output distribution stability
- User Rejection / Override Rates: Clinician telemetry in EHR/PACS
- Rolling Sensitivity / Specificity: Ground-truth clinical validation
- Brier Score Calibration: Probability reliability curve tracking
- Subgroup Parity Disparity: Demographic & clinical subgroup fairness
Unlabeled Input Telemetry: Continuous Feature Distribution Testing
Because clinical ground-truth diagnoses often lag deployment by weeks or months, the frontline defense is continuous, unsupervised feature monitoring on incoming inference payloads.
1. Population Stability Index (PSI): PSI measures the divergence between a baseline reference dataset (the clinical validation cohort, P) and a production inference cohort (Q) over a designated temporal window:
Where K represents the number of quantile bins established on the baseline validation data. In medical SaMD validation protocols, engineering teams must establish strict boundaries:
- PSI < 0.10: Nominal operation; no distribution shift detected.
- 0.10 ≤ PSI < 0.25: Moderate covariate shift; triggers automated engineering notification, increased sampling frequency, and sub-population stratification.
- PSI ≥ 0.25: Significant distribution drift; triggers formal QMS Non-Conformance, clinical quality notification, and potential activation of model rollback or fallback mode.
2. Two-Sample Kolmogorov-Smirnov (K-S) Test: For continuous physiological signals (e.g., arterial blood pressure trends, automated electrocardiogram RR-intervals), the non-parametric two-sample Kolmogorov-Smirnov test evaluates the null hypothesis that production samples stem from the cleared validation distribution:
Given large sample volumes in commercial SaaS healthcare deployments, standard p-values can become overly sensitive to clinically trivial variations. Therefore, the monitoring SOP must establish an effect-size threshold (the supremum value D) alongside family-wise error rate corrections (such as Benjamini-Hochberg FDR) across multi-dimensional feature arrays.
3. Wasserstein Distance (Earth Mover’s Distance): For high-dimensional embeddings generated by deep learning backbones (e.g., latent space representations of optical coherence tomography scans), the Wasserstein-1 metric calculates the minimum cost of transforming the distribution of production embeddings to match the reference cohort. When autoencoders or feature backbones yield latent drift exceeding predetermined Euclidean or Wasserstein boundaries, the system flags out-of-distribution (OOD) inference inputs before predictions reach clinical dashboards.
Labeled Output Telemetry: Clinical Diagnostic Performance Metrics
Unsupervised input monitoring signals when data environments change, but clinical validation requires direct measurement of diagnostic accuracy against verified clinical endpoints.
- Sensitivity / False Negative Rate (FNR) Degradation: In triage and diagnostic software, false negatives carry direct clinical safety hazards (e.g., missing an intracranial hemorrhage or malignant lesion). The monitoring SOP must establish hard statistical boundaries: an absolute decline in clinical sensitivity of ≥ 3% relative to the cleared 510(k)/PMA performance baseline (measured across a statistically powered moving window, e.g., n=250 confirmed cases) mandates immediate executive review.
- False Positive Rate (FPR) / Positive Predictive Value (PPV) Erosion: A sudden escalation in false positives leads to clinical “alarm fatigue,” prompting physicians to ignore or override alerts. A relative spike of ≥ 5% in FPR over a 30-day rolling baseline must trigger clinical workflow reviews.
- Brier Score & Calibration Drift: Raw classification metrics fail to capture degraded risk estimation. The Brier score assesses probability calibration:
BS = (1/N) Σ (ft - ot)2. If an oncology survival prediction model begins outputting miscalibrated risk probabilities despite maintaining stable overall AUROC, treatment decisions are compromised.
| Telemetry Level | Target Metric | Min Sample Size (N) | Warning Threshold (Yellow Alert) | Critical Action Threshold (Red Alert) |
|---|---|---|---|---|
| Input (Data Drift) | Population Stability Index (PSI) | 1,000 inferences | 0.10 ≤ PSI < 0.25 | PSI ≥ 0.25 |
| Input (Continuous) | KS-Test (D-statistic) | 500 records | D > 0.08 with p < 0.01 | D > 0.15 with p < 0.001 |
| Inference Behavior | Softmax Prediction Entropy | 2,500 inferences | Δ H > +15% from baseline | Δ H > +30% from baseline |
| Clinical Performance | True Clinical Sensitivity | 200 confirmed events | ≥ 2.0% absolute drop | ≥ 3.5% absolute drop or lower 95% CI breach |
| Clinical Performance | False Positive Rate (FPR) | 500 confirmed controls | ≥ 3.0% absolute increase | ≥ 5.0% absolute increase |
| Equity & Subgroups | Demographic Disparity Ratio | 100 per cohort | > 10% delta between cohorts | > 20% delta or localized sensitivity drop |
3. Satisfying FDA Pre-Market Expectations for Continuous Learning Machine Learning
Navigating regulatory review for adaptive and iteratively updated software requires strict alignment with FDA guidance on Predetermined Change Control Plans for Machine Learning-Enabled Medical Devices. Historically, the FDA exclusively cleared “locked” algorithms, in which weights and architecture remain static until a formal engineering change order and submission occur.
Today, manufacturers pursuing continuous learning machine learning FDA strategies—whether implementing automated batch-retraining pipelines or prospective adaptive models—must embed their drift monitoring plan directly into an authorized PCCP framework.
1. Description of Modifications
Defines authorized operational boundaries, retraining scope, and input limits.
2. Modification Protocol
Establishes drift triggers for retraining, data hygiene, and validation acceptance gates.
3. Impact Assessment
Maps drift modes to ISO 14971:2019 hazards, rollbacks, and clinical risk controls.
Deconstructing the PCCP Triad for Drift Governance
- Description of Modifications: The manufacturer must explicitly identify drift-induced retraining as an authorized modification. This document specifies the precise boundaries of adaptation: for instance, updating the internal weights of a CNN to accommodate new commercial radiology hardware while forbidding changes to the core network architecture, target anatomical labels, or clinical indications for use.
- Modification Protocol: This section outlines the exact mathematical criteria governing the retraining lifecycle. The drift monitoring SOP serves as the operational engine for Section 2 (Data Management) and Section 3 (Performance Evaluation) of the protocol. It must define:
- Retraining Triggers: The explicit drift metrics (e.g., cumulative PSI breaches or verified sensitivity drops) that authorize model retraining.
- Data Hygiene and Separation: Strict isolation protocols ensuring retraining sets do not contaminate prospective validation test sets.
- Acceptance Gates: Non-inferiority margins and clinical equivalence testing that a retrained model candidate must clear prior to production deployment.
- Impact Assessment: The manufacturer must trace how model drift and subsequent model updates alter device hazards. The assessment analyzes risk mitigation strategies, including automated rollback triggers, clinical fallback pathways, and safeguards against confirmation bias or localized data poisoning during retraining.
Regulatory Architecture Note: For a comprehensive roadmap on implementing these checkpoints smoothly, utilize our FDA PCCP ISO 13485 QMS Integration Checklist inside your active engineering workflows.
Good Machine Learning Practice (GMLP) Alignment
The FDA, Health Canada, and the UK MHRA jointly established 10 guiding principles for Good Machine Learning Practice (GMLP) for Medical Device Development. Principle 10 explicitly mandates that “Deployed models are monitored for performance and retraining risks are managed.” Under GMLP, drift monitoring cannot function as a standalone data science script. It must be governed as an active medical device software lifecycle process conforming to IEC 62304:2006/AMD 1:2015 Medical device software — Software life cycle processes.
4. QMS Integration: Connecting Drift Telemetry to ISO 13485:2016 & QMSR Workflows
Under the FDA QMSR, which harmonizes 21 CFR Part 820 with ISO 13485:2016, model telemetry must interface directly with quality system procedures. When production data drift exceeds a statistical boundary, that event is legally recognized as a quality data input. Teams building enterprise AI governance alongside medical quality systems can also explore how ISO 42001 and ISO 13485 harmonize AI management across the product lifecycle.
Gated Drift Incident Escalation Architecture
STAGE 1: YELLOW ALERT (PSI ≥ 0.10 OR Clinician Override Spike ≥ 10%)
- Log automated quality telemetry incident in QMS
- Restrict batch processing to low-risk clinical queues
- Initiate bi-weekly Medical Affairs case audits & unsupervised stratification
STAGE 2: RED ALERT (PSI ≥ 0.25 OR Sensitivity Drop ≥ 3.5% OR Parity Shift ≥ 15%)
- Auto-Circuit Breaker: Suspend deployed model and rollback to cleared baseline
- Open formal CAPA under ISO 13485:2016 Clause 8.5.2
- Notify Quality Assurance, Risk Management & evaluate 21 CFR Part 803 MDR reporting
Mapping Drift to ISO 13485:2016 Quality Clauses
- Clause 8.2.1 (Feedback): Automated telemetry feeds the post-market surveillance (PMS) system. Real-world inference metrics, feature divergence logs, and clinician override telemetry serve as objective post-market clinical follow-up (PMCF) data under EU MDR 2017/745 Annex XIV and FDA QMSR post-market controls.
- Clause 8.2.2 (Complaint Handling): A clinician overriding an AI recommendation because of an incorrect classification is not merely an MLOps edge case—it is a potential complaint. The monitoring architecture must integrate electronic health record override logs into the complaint handling pipeline to determine whether malfunctions or diagnostic errors could cause or contribute to adverse events (21 CFR Part 803).
- Clause 8.4 (Analysis of Data): Statistical drift metrics provide continuous trending data to evaluate where the characteristics and trends of processes and products indicate nonconformities or emerging safety risks.
- Clause 8.5.2 (Corrective Action): When a Red Alert threshold is triggered, the event must systematically generate a Corrective and Preventive Action (CAPA) ticket. The root-cause investigation isolates whether drift originated from external hardware shifts, software bugs in data pre-processing, clinical guideline evolution, or localized patient population variation.
The Role of ISO 14971:2019 Risk Management
Every alert threshold established in your drift monitoring protocol must correlate directly with the device’s Risk Management File (RMF). Under ISO 14971:2019, manufacturers must evaluate whether model decay introduces new hazards or increases the probability of occurrence of existing harm (P1). If an algorithm’s diagnostic sensitivity slips by 3.5%, the probability of a hazardous situation (undetected disease state leading to delayed medical intervention) increases. If this elevated risk exceeds the residual risk acceptability criteria approved in the design baseline, software execution must be restricted.
5. End-to-End SaMD Model Drift Monitoring Implementation Checklist
Executing an inspection-ready AI model drift monitoring medical device strategy requires close cross-functional collaboration between MLOps, Quality Assurance, Regulatory Affairs, and Clinical Operations. Follow this 10-point roadmap to establish and validate your operational framework.
Freeze the exact dataset distributions used for clinical validation and clearance. Document input feature means, variances, continuous histograms, and categorical frequency tables as controlled specifications inside the Design History File (DHF).
Determine temporal and cohort-volume windows for telemetry analysis (e.g., continuous 7-day, 30-day, and 90-day moving windows, or fixed inference buckets such as N = 1,000 executions).
Deploy automated scripts calculating PSI, two-sample Kolmogorov-Smirnov, and Wasserstein distances across all mission-critical features. Enforce multi-test correction methods to control false discovery rates across high-dimensional vectors.
Integrate audit-logging within the clinician user interface (EHR, PACS, or proprietary frontend) to record instances where an end-user rejects, modifies, or closes out an algorithm’s output without action.
Establish systematic mechanisms (such as secondary pathology reviews, formal clinical follow-up audits, or quarterly ground-truth cohort matching) to calculate continuous sensitivity, specificity, and Brier calibration curves on production patients.
Formally incorporate Yellow and Red Alert thresholds into your company’s Quality Manual. Establish standard operating procedures detailing mandatory investigation timelines (e.g., Yellow Alert investigation within 5 business days; Red Alert quarantine within 4 hours).
Engineer fail-safe architectural controls. If a critical drift threshold is breached, the system must support dynamic fallback—either shifting to a locked, validated baseline model, displaying a warning banner to clinicians, or disabling automated inference entirely.
Under FDA QMSR / ISO 13485:2016 Clause 4.1.6, software tools used in the quality system or to verify medical device performance must be validated for their intended use. Verify that drift calculation packages, telemetry databases, and automated alerting scripts undergo formal Computer Software Assurance (CSA).
Ensure your monitoring platform evaluates data drift across stratified demographic classes (age brackets, sex, race, geographic site locations). Prevent localized model collapse from remaining hidden behind stable global performance metrics.
Conduct mock incident simulations. Artificially inject covariate-drifted DICOM or EHR payloads into the staging environment. Verify that the monitoring engine triggers the correct alerts, generates automated quality tickets, alerts clinical leads, and successfully halts processing according to protocol.
6. Frequently Asked Questions (FAQ)
What is the primary difference between data drift and concept drift in medical AI?
Data drift (covariate shift) refers to changes in the statistical distribution of input data P(X) while the clinical relationship between the inputs and the true diagnosis remains unchanged. Examples include altered image resolution, new laboratory reagents, or shifting patient demographics. Concept drift occurs when the relationship between input features and clinical ground truth P(Y|X) changes over time, such as when revised medical guidelines, novel pathogen strains, or updated therapeutic regimens alter how clinical signs relate to patient outcomes.
Is an AI model drift monitoring plan mandatory for FDA 510(k) or De Novo submissions?
Yes. The FDA expects manufacturers of Machine Learning-Enabled Medical Devices (MLMD) to demonstrate that the device will remain safe and effective across its commercial lifecycle. In submissions involving a Predetermined Change Control Plan (PCCP), detailed drift monitoring specifications are required to justify how future model modifications and retraining triggers will be governed. Even for static, “locked” algorithms, post-market surveillance requirements under the FDA QMSR (21 CFR Part 820) and ISO 13485:2016 mandate mechanisms to collect and analyze production feedback to identify performance degradation.
Which statistical metric is most effective for detecting medical device data drift when ground-truth labels are delayed?
The Population Stability Index (PSI) is widely adopted because it provides an interpretable, standardized metric for quantifying categorical and binned continuous distribution shifts against cleared baseline cohorts. When combined with the non-parametric Two-Sample Kolmogorov-Smirnov (KS) test for continuous features and Wasserstein Distance for high-dimensional latent space embeddings, engineering teams can detect covariate shift across incoming hospital telemetry before delayed clinical outcomes reveal diagnostic degradation.
How does an automated drift alert integrate with an ISO 13485:2016 QMS?
An automated drift alert acts as an objective input into the manufacturer’s post-market surveillance (Clause 8.2.1) and analysis of data (Clause 8.4) systems. If telemetry crosses a predefined critical threshold (Red Alert), the event triggers an automated non-conformance record, prompts risk management re-evaluation under ISO 14971:2019, and initiates a formal CAPA investigation (Clause 8.5.2) to determine root cause and deploy corrective actions, such as model rollback, clinical warnings, or controlled model retraining.
7. Strategic Perspective: Moving from Reactive Patching to Resilient SaMD Lifecycle Governance
The historical paradigm of medical software maintenance—relying on passive customer complaints, annual field reviews, and periodic bug fix releases—is obsolete in the era of artificial intelligence. Machine learning models deployed into complex clinical workflows are deeply coupled to the operational environments they observe. When clinical practices evolve, algorithms shift from precision diagnostic aids to silent vectors of clinical risk.
Treating your AI model drift monitoring medical device strategy as a core pillar of your regulatory defense changes the competitive landscape. Forward-thinking digital health organizations do not view drift monitoring as an administrative post-market overhead. Instead, they leverage mathematically rigorous, automated drift telemetry to validate the safety bounds of their technology, build trust with clinical stakeholders, and accelerate post-market product iterations under modern regulatory frameworks like the FDA PCCP.
By unifying data science telemetry with the structured rigor of ISO 13485:2016 and the FDA QMSR, medtech leaders transform post-market surveillance from a reactive compliance exercise into a continuous engine of clinical safety, product quality, and long-term market leadership.
📚 Explore Our Medical Device AI & QMSR Governance Series
Primary Regulatory & Industry References
- U.S. Food and Drug Administration (FDA): Predetermined Change Control Plans for Machine Learning-Enabled Medical Devices: Guidance for Industry and FDA Staff.
- International Organization for Standardization (ISO): ISO 13485:2016 Medical devices — Quality management systems — Requirements for regulatory purposes.
- International Organization for Standardization (ISO): ISO 14971:2019 Medical devices — Application of risk management to medical devices.
- FDA, Health Canada, UK MHRA: Good Machine Learning Practice for Medical Device Development: Guiding Principles (GMLP).
- International Medical Device Regulators Forum (IMDRF): Machine Learning-enabled Medical Devices: Key Terms and Definitions (IMDRF/AIMD WG/N67FINAL:2022).
- European Commission: Regulation (EU) 2017/745 of the European Parliament and of the Council on Medical Devices (EU MDR), Annex XIV (PMCF).
Disclaimer: This guide is intended for educational, technical, and regulatory engineering purposes and does not constitute formal legal, statistical, or clinical advice. Medical device manufacturers should consult qualified regulatory affairs and quality assurance professionals to tailor their AI drift monitoring and change control strategies to their specific device classifications, intended uses, and regional jurisdictions.

P. Murugesh is a Regulatory Affairs Specialist with over 18 years of experience navigating the complex landscape of healthcare regulations, compliance, and product development. Combining his deep pharmaceutical industry knowledge and expertise, he founded MediTech Chronicles to share his passion for innovation and simplify complex scientific concepts for the next generation of healthcare professionals.